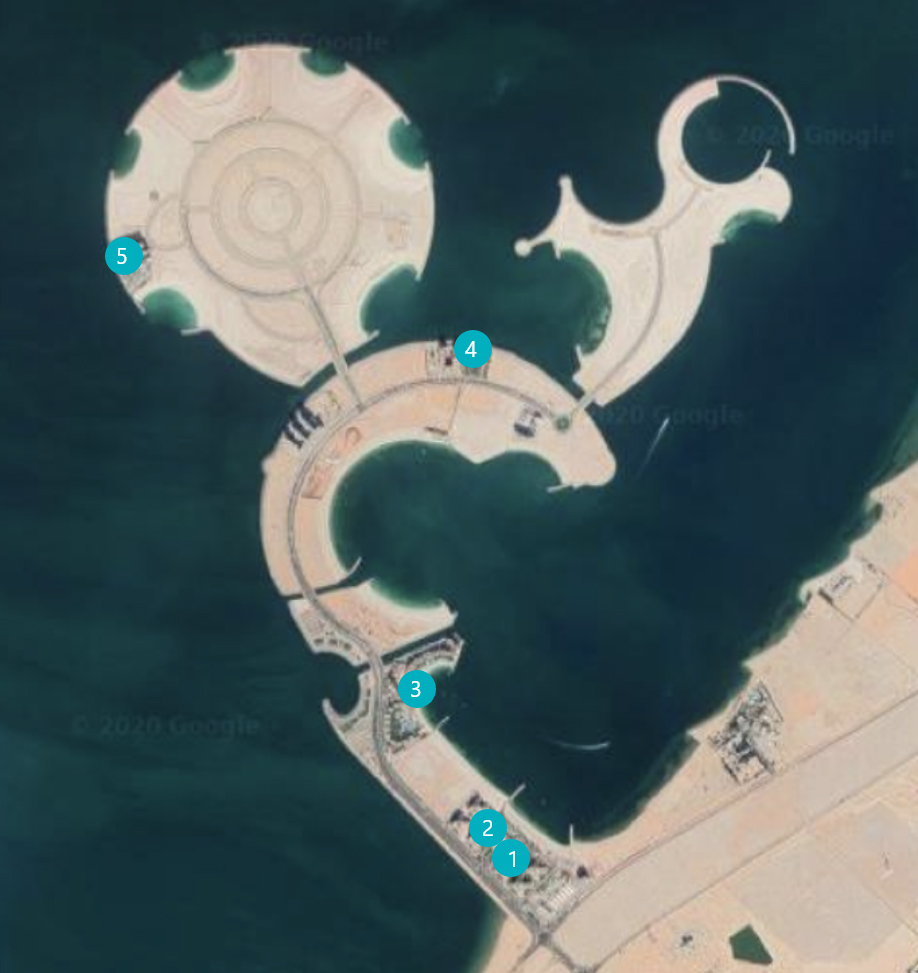
HOSPITALITY DEVELOPMENT


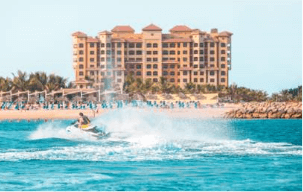
Rixos Bab Al Bahr 647 keys
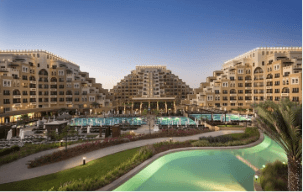
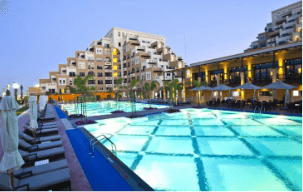
Marjan Island Resort & Spa 299 keys
Bab Al Bahr Residences 512 units
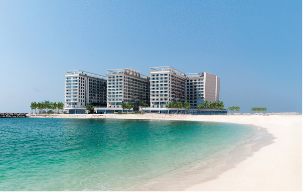
Bab Al Bahr Residences 512 units
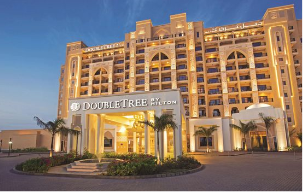
Double Tree by Hilton 723 keys

Movenpick
Address RAK

Rove Al Marjan Island

Radisson
Al Mahra Resort

Saudi German Hospital

Hampton by Hilton
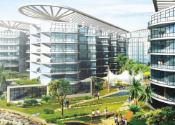
Uniestate Living Bay

Avani Hotels

Hotel Resorts
Supercasa Hotel

Conrad Hotels

Movenpick

Barcelo Hotel Group
TURNKEY PROJECTS
LAND SALE
Land sale on Al Marjan Island for a variety of uses, including:
- Hospitality
- Mixed use
- Residential
- Retail
- Leisure
Land sale with pre-approved operator offering incentives such as operating profit guarantees over an extended period
Healthcare/wellness
Staff accommodation
Ticket size:
USD 5 – 10 million
TURNKEY INVESTMENT
Rove Hotel
441-key, 3-star beachfront hotel on Al Marjan Island
Developer-provided, minimum operating profit guarantee of 7% over 7 years
Barcelo Hotel
602-key, 5-star beachfront hotel on Al Marjan Island
Developer-provided, minimum operating profit guarantee over 10 years
Ticket size:
USD 80 – 160 million
JV’s & FINANCING
JV structure with:
Hotel operator
Retail operator
Ticket size:
Over USD 10 million
DEVELOPMENT MANAGEMENT SERVICES
Development management of a real estate project on behalf of clients like hotel operators and owners, and high-net-worth individuals.
Fees: 3 – 5% of
construction budget
ESTIMATE OF POTENTIAL RETURNS FOR A
HYPOTHETICAL 200-KEY HOTEL INVESTMENT
Al Marjan Island |
Palm Jumeirah |
Saadiyat Island |
|
|---|---|---|---|
| Occupancy (%) |
|
|
|
| Average daily rate (USD) | 210 | 300 | 232 |
| RevPAR (USD) | 151 | 240 | Sweden |
| Profit conversion (%) |
|
|
|
| Site acquisition and construction cost (‘000 USD) |
68,065 | 87,602 | 71,485 |
| Equity IRR (%) |
|
|
|
70%
Over 70%occupancy
$175
ADR$123
RevPARSource: Colliers International, RAK – Emirate of Opportunity Study, 2019
Wellness Resort
| Sample land area: | 1 SqFt |
| Floor area ratio: | 0.32 |
| GFA: | 0.32 |
| Land price: | USD 95 per SqFt (Land) |
| Construction cost: | USD 205 per SqFt (GFA) |
| Soft cost: | 8.00% of construction cost |
| Opex to revenues: | 55% of revenues |
| Exit cap rate: | 9.00% |
Stabilized
performance
KPIs
Occupancy
70%
ADR
USD 367
Other revenues
105% of room rev.
Return of investment
16.00%
Project IRR
17.00%
Payback period
9 - 10 years
Cash flow is based on USD per SqFt of land
| Project cash flow USD MN |
Year 1 | Year 2 | Year 3 | Year 4 | Year 5 | Year 6 | Year 7 | Year 8 |
|---|---|---|---|---|---|---|---|---|
| Revenues | 54 | 55 | 57 | 58 | 60 | |||
| Opex | (30) | (30) | (31) | (32) | (33 | |||
| Land Cost | (67) | (29) | ||||||
| Construction Cost | (20) | (20) | (13) | (13) | ||||
| Professional Fees | (4) | (1) |
Serviced Apartments
| Sample land area: | 1 SqFt |
| Floor area ratio: | 2.75 |
| GFA: | 2.75 |
| Land price: | USD 95 per SqFt (Land) |
| Construction cost: | USD 122 per SqFt (GFA) |
| Soft cost: | 8.00% of construction cost |
| Opex to revenues: | 55% of revenues |
| Exit cap rate: | 9.00% |
Stabilized performance KPIs
Occupancy 70%
ADR USD 177
Other revenues 30% of room rev.
Return of investment
16.00%
Project IRR
22.00%
Payback period
9 - 10 years
Cash flow is based on USD per SqFt of land
| Project cash flow USD MN |
Year 1 | Year 2 | Year 3 | Year 4 | Year 5 | Year 6 | Year 7 | Year 8 |
|---|---|---|---|---|---|---|---|---|
| Revenues | 187 | 192 | 197 | 202 | 207 | |||
| Opex | (103) | (106) | (108) | (111) | (114) | |||
| Land Cost | (67) | (29) | ||||||
| Construction Cost | (101) | (101) | (67) | (67) | ||||
| Professional Fees | (22) | (5) |